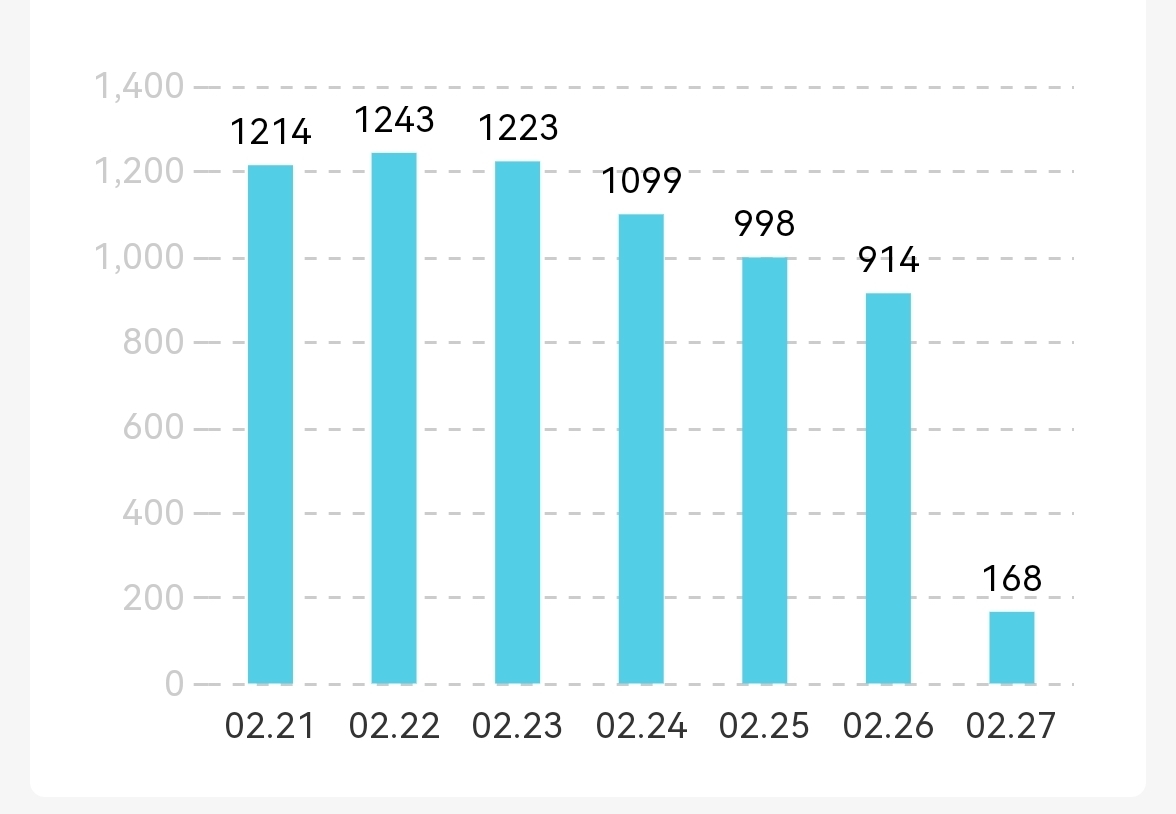
小程序Echarts封装
- 封装公共的柱状图组件,并在需要的页面引入使用。要求一个页面中有多个饼图,动态渲染不同的数据。

1. 下载 GitHub 上的 ecomfe/echarts-for-weixin 项目,Echarts微信版。
地址:https://github.com/ecomfe/echarts-for-weixin
2. 将 ec-canvas 文件放置到小程序分包后的文件夹中
3. 封装柱状图公共组件
html
// ec-bar
<view class="canvas-container">
  <ec-canvas id="echarts" canvas-id="echarts" week="{{week}}" weekData="{{weekData}}" ec="{{ ec }}"></ec-canvas>
</view>
javascript
import * as echarts from "../ec-canvas/echarts";

let chart = null;

// 初始化图表函数
function initChart(canvas, width, height, dpr, week, weekData) {
  chart = echarts.init(canvas, null, {
    width: width,
    height: height,
    devicePixelRatio: dpr
  })

  canvas.setChart(chart)

  let option = {
    grid: {
      left: "3%",
      right: "4%",
      bottom: "3%",
      top: "13%",
      containLabel: true,
    },
    xAxis: {
      type: 'category',
      data: week,
      axisTick: {
        show: false,
      },
      axisLine: {
        show: false,
      },
      splitLine: {
        show: false,
        lineStyle: {
          type: "dotted",
        },
      },
    },
    yAxis: {
      type: 'value',
      axisLine: {
        show: false,
        lineStyle: {
          color: "#ccc",
        },
      },
      splitLine: {
        show: true,
        lineStyle: {
          type: "dashed",
        },
      },
    },
    series: [
      {
        barWidth: 15,
        data: weekData,
        type: 'bar',
        label: {
          show: true,
          position: "top",
          textStyle: {
            color: "#000",
          },
        },
        itemStyle: {
          color: '#52cee7'
        }
      },
    ]
  }
  chart.clear()
  chart.setOption(option);
  return chart;
}

Component({
  // 接收页面传递过来的柱状图数据
  properties: {
    week: {
      type: Array
    },
    weekData: {
      type: Array
    }
  },
  data: {
    ec: {
      onInit: initChart
    }
  }
})
json
{
  "component": true,
  "usingComponents": {
    "ec-canvas": "../ec-canvas/ec-canvas"
  }
}
4. 父组件页遍历 ec-bar 柱状图组件,并传过去需要的数据
html
<--父组件-->
<view class="card-item" wx:for="{{item.data}}" wx:key="i" wx:for-item="i">
    <ec-bar week="{{i.week}}" weekData="{{i.weekData}}" wx:if="{{i.diyRemarkCnt > 0}}"></ec-bar>
</view>
json
// 父组件
{
  "usingComponents": {
    "ec-bar": "../../components/ec-bar/index"
  }
}